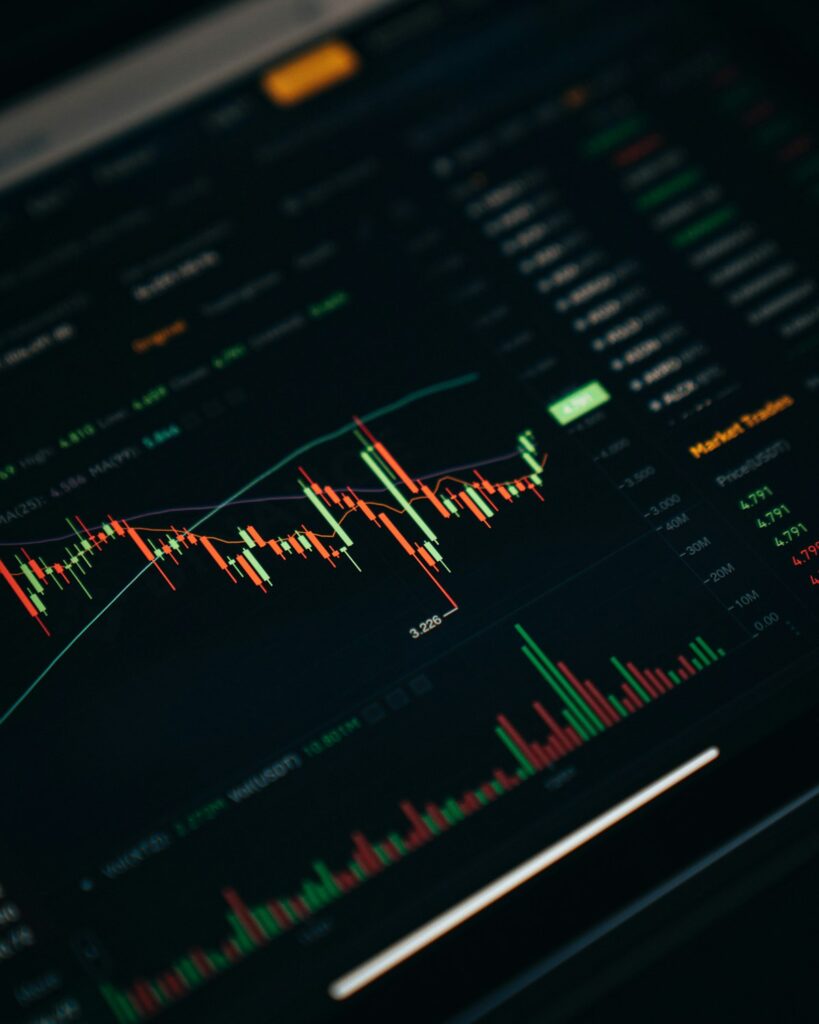
Technical analysis is the backbone of crypto trading. Whether you’re a beginner trying to understand price movements or an intermediate trader looking to sharpen your skills, knowing how to read crypto charts is the single most important skill you can develop. This guide makes it simple.
Why Chart Reading Matters in Crypto
Crypto markets are driven by supply and demand, speculation, and sentiment — all of which leave visible patterns on price charts. By learning to read these patterns, you can:
- Identify high-probability entry and exit points
- Spot market reversals before they happen
- Set intelligent stop losses and profit targets
- Trade with confidence instead of guesswork
Understanding Candlestick Charts
The candlestick chart is the most widely used chart type in crypto trading. Each candle represents a specific time period and shows four key data points:
- Open: The price at the start of the period
- Close: The price at the end of the period
- High: The highest price reached during the period
- Low: The lowest price reached during the period
A green (bullish) candle means the price closed higher than it opened. A red (bearish) candle means the price closed lower than it opened. The thin lines above and below the body are called “wicks” or “shadows” and show the price extremes.
Key Candlestick Patterns Every Trader Should Know
Bullish Reversal Patterns
- Hammer: Small body at the top, long lower wick. Signals potential reversal upward after a downtrend.
- Bullish Engulfing: A large green candle completely engulfs the previous red candle. Strong buy signal.
- Morning Star: Three-candle pattern indicating the end of a downtrend and beginning of an uptrend.
Bearish Reversal Patterns
- Shooting Star: Small body at the bottom, long upper wick. Signals potential reversal downward.
- Bearish Engulfing: A large red candle engulfs the previous green candle. Strong sell signal.
- Evening Star: Three-candle pattern signaling the end of an uptrend.
Support and Resistance: The Foundation of Chart Analysis
Support levels are price zones where buying pressure has historically stopped a decline. Think of support as a floor — when price approaches it, buyers step in.
Resistance levels are zones where selling pressure has historically stopped an advance. Think of resistance as a ceiling — when price approaches it, sellers step in.
How to identify them:
- Look for price levels where the chart has reversed multiple times
- The more times a level has been tested, the stronger it is
- When support breaks, it often becomes the new resistance (and vice versa)
Essential Technical Indicators
Relative Strength Index (RSI)
RSI measures the speed and magnitude of price movements on a scale of 0–100. Values below 30 suggest the asset is oversold (potential buy zone), while values above 70 suggest it’s overbought (potential sell zone).
Moving Averages (MA)
Moving averages smooth out price data to reveal the underlying trend. The most watched levels are the 50-day MA and 200-day MA. When the 50-day crosses above the 200-day, it’s called a “Golden Cross” — a bullish signal. The opposite is a “Death Cross” — a bearish signal.
MACD (Moving Average Convergence Divergence)
MACD shows the relationship between two moving averages. When the MACD line crosses above the signal line, it generates a buy signal. When it crosses below, it generates a sell signal.
Volume
Volume is often overlooked but crucial. Price moves accompanied by high volume are more significant and reliable than moves on low volume. Always check volume when a breakout occurs.
Chart Patterns That Predict Major Moves
- Head and Shoulders: Signals a reversal from uptrend to downtrend. One of the most reliable bearish patterns.
- Double Bottom: Two similar lows followed by a break above the neckline — a strong bullish reversal signal.
- Ascending Triangle: Higher lows with a flat resistance — usually breaks upward. Bullish continuation pattern.
- Falling Wedge: Price contracts between two downward-sloping lines — typically breaks upward. Bullish reversal.
Choosing the Right Timeframe
Different timeframes serve different purposes:
- 1M–5M charts: For scalpers looking at very short-term moves
- 15M–1H charts: Day traders’ primary timeframe for entry signals
- 4H charts: Swing traders use this to identify the medium-term trend
- Daily/Weekly charts: For position traders and identifying the overall market direction
Best practice: always check the higher timeframe first to understand the big picture, then zoom into a lower timeframe for your entry.
Chart Reading Takes Time — Signals Can Help
Mastering chart reading takes months of practice. Many successful traders use professional crypto signal services to complement their own analysis, gaining access to expert chart reads with precise entry, take profit, and stop loss levels — allowing them to trade well while continuing to learn.
Final Thoughts
Reading crypto charts is a skill that pays dividends for life. Start with the basics — candlestick patterns and support/resistance — then gradually add indicators to your toolkit. The key is to practice consistently on real charts before risking capital.
Want professional chart analysis delivered to you daily? Explore our daily signal service and trade with the confidence of having expert analysis in your corner.